


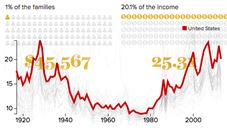
What this report finds: Income inequality has risen in every state since the 1970s and in many states is up in the post–Great Recession era. In 24 states, the top 1 percent captured at least half of all income growth between 2009 and 2013, and in 15 of those states, the top 1 percent captured all income growth. In another 10 states, top 1 percent incomes grew in the double digits, while bottom 99 percent incomes fell. For the United States overall, the top 1 percent captured 85.1 percent of total income growth between 2009 and 2013. In 2013 the top 1 percent of families nationally made 25.3 times as much as the bottom 99 percent.
Why it matters: Rising inequality is not just a story of those in the financial sector in the greater New York City metropolitan area reaping outsized rewards from speculation in financial markets. While New York and Connecticut are the most unequal states (as measured by the ratio of top 1 percent to bottom 99 percent income in 2013), nine states, 54 metropolitan areas, and 165 counties have gaps wider than the national gap. In fact, the unequal income growth since the late 1970s has pushed the top 1 percent’s share of all income above 24 percent (the 1928 national peak share) in five states, 22 metro areas, and 75 counties.
What does inequality look like in your state?
Explore inequality by state, county, and metro area in this interactive feature.
What we can do to fix the problem: The rise of top incomes relative to the bottom 99 percent represents a sharp reversal of the trend that prevailed in the mid-20th century. Between 1928 and 1979, the share of income held by the top 1 percent declined in every state except Alaska (where the top 1 percent held a relatively low share of income throughout the period). This earlier era was characterized by a rising minimum wage, low levels of unemployment after the 1930s, widespread collective bargaining in private industries (manufacturing, transportation [trucking, airlines, and railroads], telecommunications, and construction), and a cultural and political environment in which it was outrageous for executives to receive outsized bonuses while laying off workers. We need policies that return the economy to full employment, return bargaining power to U.S. workers, and reinstate the cultural taboo on allowing CEOs and financial-sector executives at the commanding heights of the private economy to appropriate more than their fair share of the nation’s expanding economic pie.
Executive summary
While economic inequality has been one of the hottest topics this presidential campaign season, much of the focus has been on the fortunes of the top 1 percent at the national level. This report, our third annual such analysis, uses the latest available data to examine how the top 1 percent in each state have fared over 1917–2013, with an emphasis on trends over 1928–2013. (Data for additional percentiles spanning 1917–2013 are available at go.epi.org/unequalstates2016data.)
This third edition includes two new elements: We examine top incomes by metropolitan area and county in 2013.
Our analysis provides a number of major findings that confirm the widespread extent and growth of income inequality that is heightening economic anxiety among the American electorate:
In 2013, income inequality was much higher in many states, metropolitan areas, and counties than for the United States overall. In 2013 the top 1 percent of families nationally made 25.3 times as much as the bottom 99 percent.
- Nine states had gaps wider than the national gap. In the most unequal states—New York, Connecticut, and Wyoming—the top 1 percent earned average incomes more than 40 times those of the bottom 99 percent.
- Fifty-four of 916 metropolitan areas had gaps wider than the national gap. In the 12 most unequal metropolitan areas, the average income of the top 1 percent was at least 40 times greater than the average income of the bottom 99 percent. Most unequal was the Jackson metropolitan area, which spans Wyoming and Idaho; there the top 1 percent in 2013 earned on average 213 times the average income of the bottom 99 percent of families. The next 11 metropolitan areas with the largest top-to-bottom ratios were Bridgeport-Stamford-Norwalk, Connecticut (73.7); Naples-Immokalee-Marco Island, Florida (73.2); Sebastian-Vero Beach, Florida (63.5); Key West, Florida (58.5); Gardnerville Ranchos, Nevada (46.1); Miami-Fort Lauderdale-West Palm Beach, Florida (45.0); Midland, Texas (44.3); Glenwood Springs, Colorado (42.4); San Angelo, Texas (40.9); Las Vegas-Henderson-Paradise, Nevada (40.7); and Summit Park, Utah (40.3).
- 165 of 3,064 counties had gaps wider than the national gap. The average income of the top 1 percent was at least 45 times greater than the average income of the bottom 99 percent in 25 counties. In Teton, Wyoming (which is one of two counties in the Jackson metropolitan area), the top 1 percent in 2013 earned on average 233 times the average income of the bottom 99 percent of families.


