


![]()
![]()
![]()
![]()
![]()
![]() Black poverty rates are more than twice as high as white poverty rates.
Black poverty rates are more than twice as high as white poverty rates.
50 years ago during the civil rights movement, the Poor People’s Campaign set out to put poverty reduction front and center on the national agenda. Over six weeks in 1968, a community-led multiethnic movement brought national attention to the plight of poor people in the United States. Today, as preparations begin around the country to commemorate the 50th anniversary of this campaign, we can look back and see what progress has been made and where works still needs to be done. This snapshot is the first in a series that will hopefully help readers understand the challenges surrounding poverty that remain today.
The current official U.S. poverty measure has been used since the 1960s, when it was devised as part of the “War on Poverty.” The official poverty line was originally set at approximately three times a basic food budget, adjusted by family size and composition, and it is updated annually by overall inflation. It is not a perfect measure of poverty. The thresholds are too low (largely because food prices rose more slowly than other prices since its inception) and it doesn’t count some key resources poor families rely on (such as in-kind public benefits like Medicaid or food stamps). In later snapshots, we’ll turn to the Supplemental Poverty Measure (SPM), a measure that better reflect both the resources families can access and the true cost of living. Whatever the measure’s shortcomings, it remains the official poverty rate reported by the federal government each year and the one used for determining eligibility for many safety net programs—and families that live below the official poverty line today are clearly facing genuine economic distress.
The figure below shows the official poverty rates of Americans overall as well as by age and race. Overall, about one in eight Americans live below the poverty line, which is about $25,000 for a family of four. According to the official measure, Americans ages 65 and up have seen the largest declines in poverty since 1968—from 25.0 percent to 9.3 percent—thanks primarily to Social Security. Social Security expansions to cover occupations initially excluded by the program, along with improved access to jobs and higher education driven by the civil rights movement, led to large declines in black poverty even before 1968, and this rate fell from 34.7 percent in 1968 to 22.0 percent today. An often-overlooked decline in black poverty also took place during the tight labor market of the 1990s. Between 1994 and 2001, black poverty fell almost 8 full percentage points, as persistent low unemployment disproportionately helped historically disadvantaged groups.
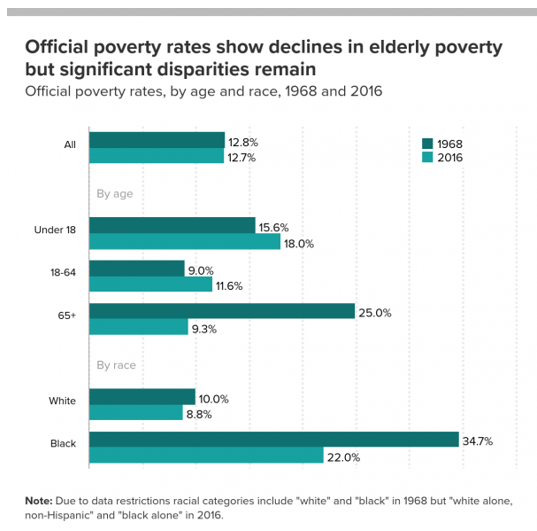
After falling sharply between 1959 and 1968, the white poverty rate has continued to fall modestly. Today, the black poverty rate remains more than twice as high as the white poverty rate.
Children today face the highest rates of poverty of any age group, with 18.0 percent of all children living below the poverty line. Given how effectively poverty limits economic mobility, it is well past time for the United States to make a major push to radically reduce child poverty.


